

A decision support system (DSS) is an interactive information system that analyses large volumes of data to inform business decisions. A DSS supports the management, operations, and planning levels of an organisation in making better decisions by assessing the significance of uncertainties and the tradeoffs involved in making one decision over another.
A DSS leverages a combination of raw data, documents, personal knowledge, and/or business models to help users make decisions. The data sources used by a DSS could include relational data sources, cubes, data warehouses, electronic health records (EHRs), revenue projections, sales projections, and more [1].
This project, conducted by HealthyData.Science, applies these decision-support principles to a highly regulated life sciences context. The objective of this Decision Support System is to predict failures from a peristaltic pump, during the ‘fill finish’ stage, of a Biopharma workflow [2] using a Bayesian Network (BN). As this is a very critical stage of operations, transporting a very valuable and potentially life changing product, it’s pertinent that failures are detected in real time, to ensure no loss of product or costly downtime of the process.
Hence, the system will also utilise a Digital Twin (DT) [3], to make analysis in real time. As applied to biopharma workflows, the digital twin is a type of process assistant that has online and real-time access to data/ probabilities, including historical data and present process conditions. The DT can then be used to simulate the future based on all possible effective models. Modelling is often based on Bayesian analysis (such as our network), a statistical paradigm that answers research questions about unknown parameters using probability statements [4]. We will answer three queries in our code, in our Jupyter Notebook.
Tasks
There are two types of failures that can potentially occur in our system:
Type 1) Failure to deliver enough sterile product to the vials/ bottles
Type 2) Liquid leakage inside the pump.
Type 1 failures can be caused by partial malfunctioning of the pump parts, like worn mechanical components or electrically damaged material.
Type 2 failures take place when the tube of the pump is disintegrated, and the component is fully malfunctioned.
We can predict the peristaltic pump failure using our BN nodes, and using the input and output parameters. The network should receive data about the state of the system components. Based on the received data, it should predict the risks of both types of failure, either; Low or High.
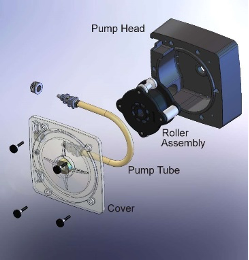
Peristaltic Pump Architecture
The peristaltic pump system can be divided into five main parts:
1) Motor
2) Motor electronics housing
3) Control electronics
4) Tube
5) Roller [6]
This was an AI/ decision support system project. Unlike other projects, it wasn’t data driven using Machine Learning models. It was knowledge based.
Constraints
The DSS is based on BN reasoning and uses discrete conditional probabilities, instead of continuous ones. The network does not provide an exact measurement, but provides a good estimate of risk.
Conceptual Design
The DSS is designed to be integrated with the DT, where the DT can predict possible performance outcomes and detect faults.
The DSS will also be integrated with other process equipment in the Biopharma workflow. There are 5 stages to the Biopharma workflow and vaccine manufacturing.
1. Media Preparation
2.Fermentation
3.Harvesting
4.Purification
5.Fill Finish
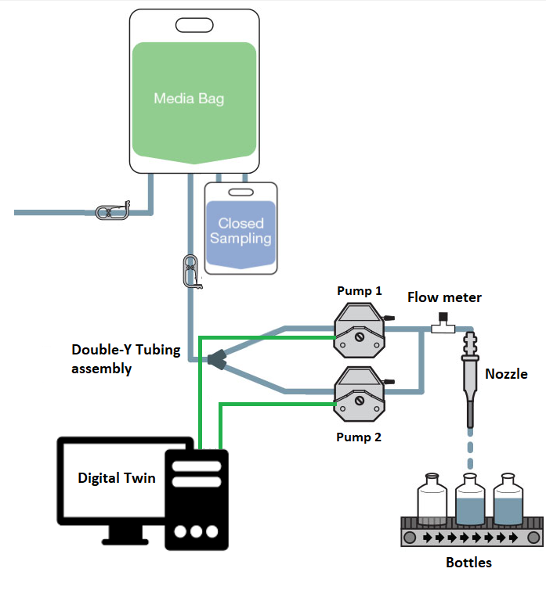
As fill finish is a critical stage of the Biopharma workflow (figure 3), it’s important to have our DSS in place here. Peristaltic pump 2 is a standby, incase our DSS detects a breakdown in our tubing, rollers and/ or flowrate. There should also be a flowmeter (with calibration certificate) installed after the peristaltic pump, which measures volume of the sterile product flow in unit time. Pressurised sterile product is then metered into the bottles. The bottles are sensitive to the amount of product delivered and the flow rate of the pump should be always normal (default). As a default, the motor current is monitored against normal working load conditions. [2]
Stakeholders
Manufacturing companies, governments, and industrial organisations would be typical stakeholders for this type of DSS. With Biopharma CEO’s, plant managers and operators capitalising from its use.
Overall Architecture of DSS
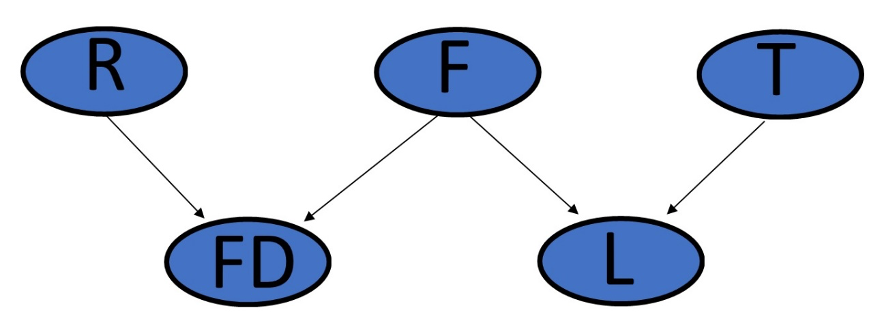
In total, there are 5 nodes; 3 nodes for the network input:
1) Risk of fail due to roller age (R)
2) Risk of fail due to decrease in flow rate (F)
3) Risk of fail due to tube age (T)
And 2 nodes for types of failures, the network output:
4) Failure to deliver enough sterile product to the vials/ bottles (FD)
5) Liquid leakage inside the pump (L).
Type 1 failures can be predicted by measuring, ‘Risk of fail due to roller age (R)’ and, ‘Risk of fail due to decrease in flow rate (F)’.
Type 2 failures can be predicted by measuring, ‘Risk of fail due to tube age (T)’ and, ‘Risk of fail due to decrease in flow rate (F)’. The node connections are visualised in figure 4.
Potential Risks
For better clarification of risk, these node connection special cases can be taken into consideration. For example, if:
1.Potential Type 1 Failures: Estimating Type 1 failure risk based only on roller age, is not the correct procedure. It could be, that the roller is very old which dictates that the risk is high. However, flow rate could be normal, which minimises the risk dramatically.
2.Potential Type 2 Failures: Similarly, if tube age (T) is new, and flow measurement (F) has no flow, one may consider that the Type 2 failure risk is low. However, if measuring flow rate and suddenly discovering that the flow rate has decreased dramatically, then that same risk becomes high.
Choosing nodes for the Bayesian network
The motor, motor electronics housing and control electronics are relatively durable parts compared to tube and roller, which are under constant pressure when the pump works. As the tube and rollers primarily contribute to peristaltic pump failure, they have assigned individual nodes in our BN. Also, as flow rate is critical in delivering sterile product to the vials, this is our final assigned node. Type 1 and Type 2 failures also require individual nodes.
It is possible to assign the motor, motor current and control electronics to individual nodes. However, the network would be too complex.
The background knowledge was obtained by using mathematical formula (and graphs). For example, formula for describing relationships between the mechanical parts lifetime and its health can be used to calculate the probabilities of risk of fail, due to mechanical component age. After obtaining the probabilities, we constructed our Bayesian Network with conditional probability distributions assigned to each node.
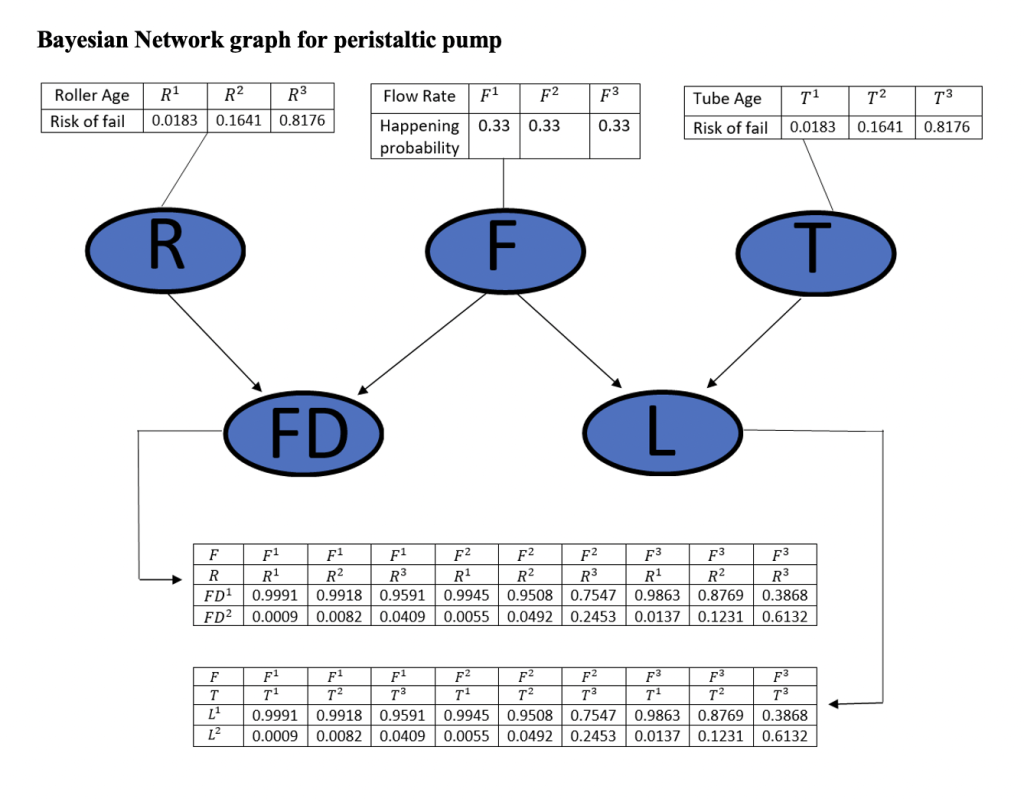
Representation of Background Knowledge as a Bayesian Network
Mechanical Parts lifetime
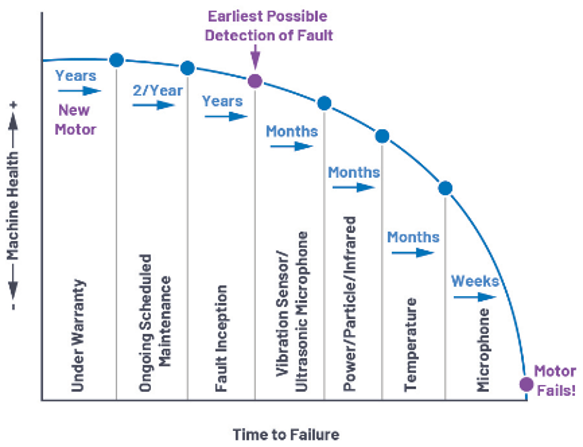
As we see from the figure 5, health of the mechanical part (motor), which is in constant motion, decreases exponentially with respect to time and working hours. In the peristaltic pump case, such mechanical parts are the motor, tube and rollers.
Calculating input nodes conditional probabilities distributions
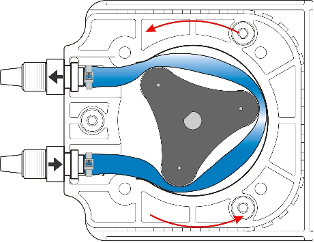
Roller heads
Roller Assembly is the peristaltic pump component which can fail due to age. For liquid transportation, rollers during roll create pressure on the tube surface (figure 2). During rolling, they wear [4], and pump efficiency lowers time by time, exponentially.
Roller age is divided into 3 categories; new, medium and old. A roller is new if its age is no more than 10% of the manufacturers guaranteed working time period. Similarly, medium and old roller ages are defined as; 10-50% and 50-100% respectively.
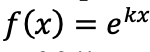
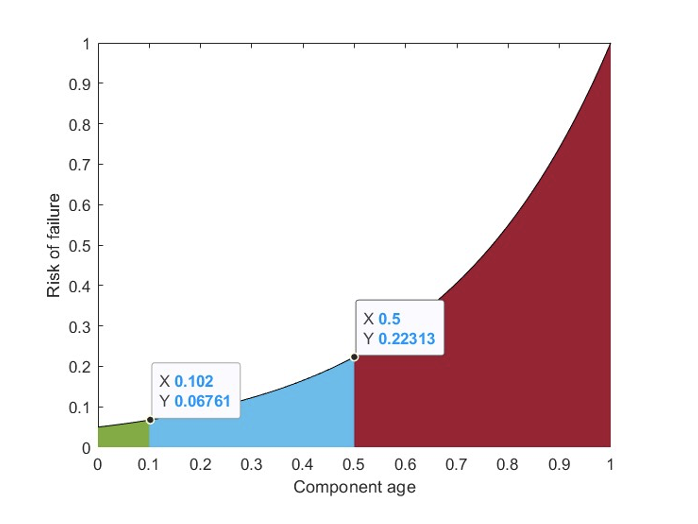
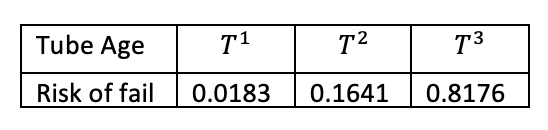
Figure 6 highlights risk of failure dependency on component age. The figure was plotted In MATLAB software using Equation 1 below. From figure 6, we see that new and medium components have risk of fail, no more than 6.7% and 22.13% respectively. Conditional probability distribution (CPD) for Roller heads, risk of fail, can be calculated by estimating area under the curve. For example, CPD for medium age is area under the curve, between component age = 0.1 -0.5 interval which is 0.1641% of total area under the curve (blue area).
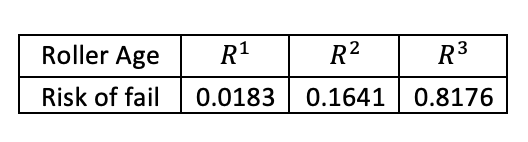
Table 1 represents CPD for all three age categories. Area under the curve was estimated using the MATLAB trapz() function.
Tubes
During pumping, the roller head is deforming the tube which causes degradation of tube with time. Tube health also degrades exponentially with respect to the number of operating hours. Tube age is also categorized into 3 categories: new, medium and old. Like rollers, a tube is new if its age is no more than 10% of the manufacturer guaranteed working time period. Similarly medium and old ages are defined as 10-50% and 50-100% respectively. Because tube life also decreases exponentially, and it has 3 categories, CPD of tube is identical to CPD for Risk of fail due to roller age, given on table 2.
Flow rate
Flow rate is measured by the flow meter. Measured value is divided into 3 categories: “Normal”, “Decreased” and “Very Decreased”. According to reference [7], the flow rate of tubes decreased linearly with respect to working hours as shown in the figure 7. For example, normal flow rate and maximum allowable decrease in flow rate is .
The Flow meter shows that actual measurement is which means that a ratio of flow rate difference () and maximum allowable flow rate decrease is 2/5=40%.
If <= 10% then flow rate is classified as “Normal”,
If >10 and <50% it is classified as “Decreased,” otherwise it is “Very Decreased”.
Average values of are: 5%, 30% and 75% for “Normal”, “Decreased” and “Very Decreased” respectively.
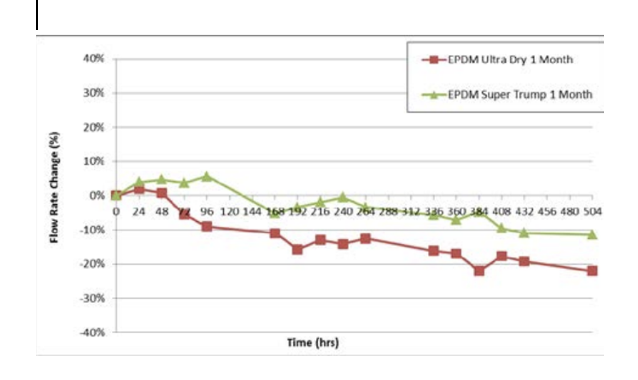
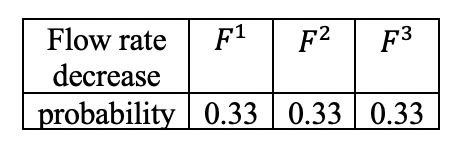
As flow rate is decreased linearly, probabilities of all 3 categories are equal to 1/3. CPD for flow rate is highlighted on Table 3.
Calculating output nodes conditional probabilities distributions
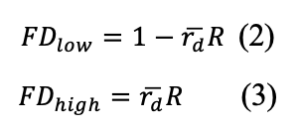
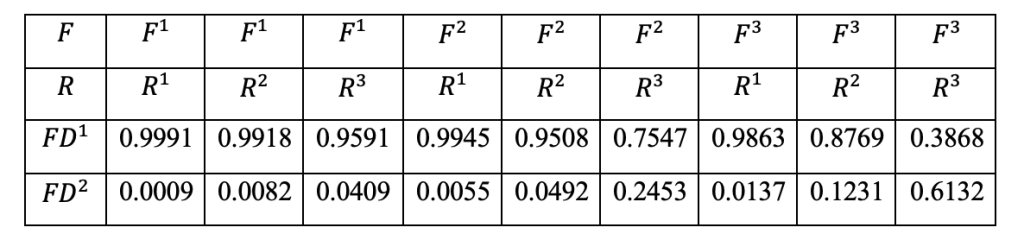
FD nodes have two parent nodes, R and F. Both parent nodes CPD dimensions are 3×1, which means that FD node CPD should have a minimum of 9 rows. FD can be calculated using the following equation:
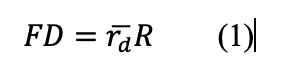
Where is an average value of for given flow rate decrease category.
Where d is the difference between normal flow rate and actual flow rate, and R is R node value. For better clarification of the above formula, an example is given e.g. we measure R node and roller is new (R=0.0183) and measure flow rate, and it is normal. Which means that both parameter values (Roller is new and flow rate is normal) tells us about low risk of fail which matches the (1) formula result. FD has 2 categories of risk: low and high. Equations for calculating probability for each level of risk are:
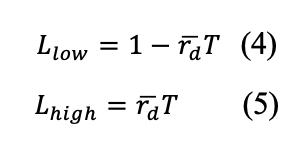
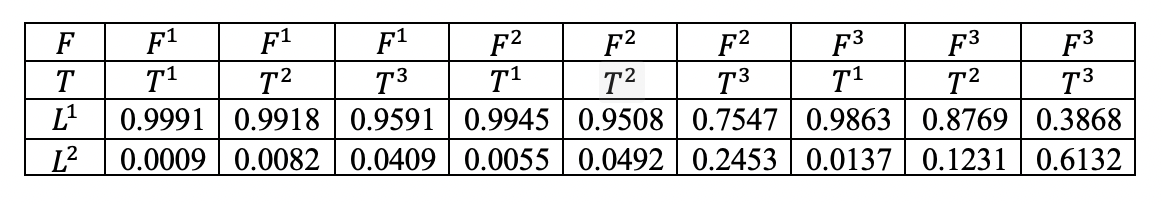
L node has 2 parents F and T, and both parents have 3×1 dimension CPD, therefore L node CPD has 9 rows. L has 2 categories of risk: low and high. Equations for calculating probability for each level of risk are:

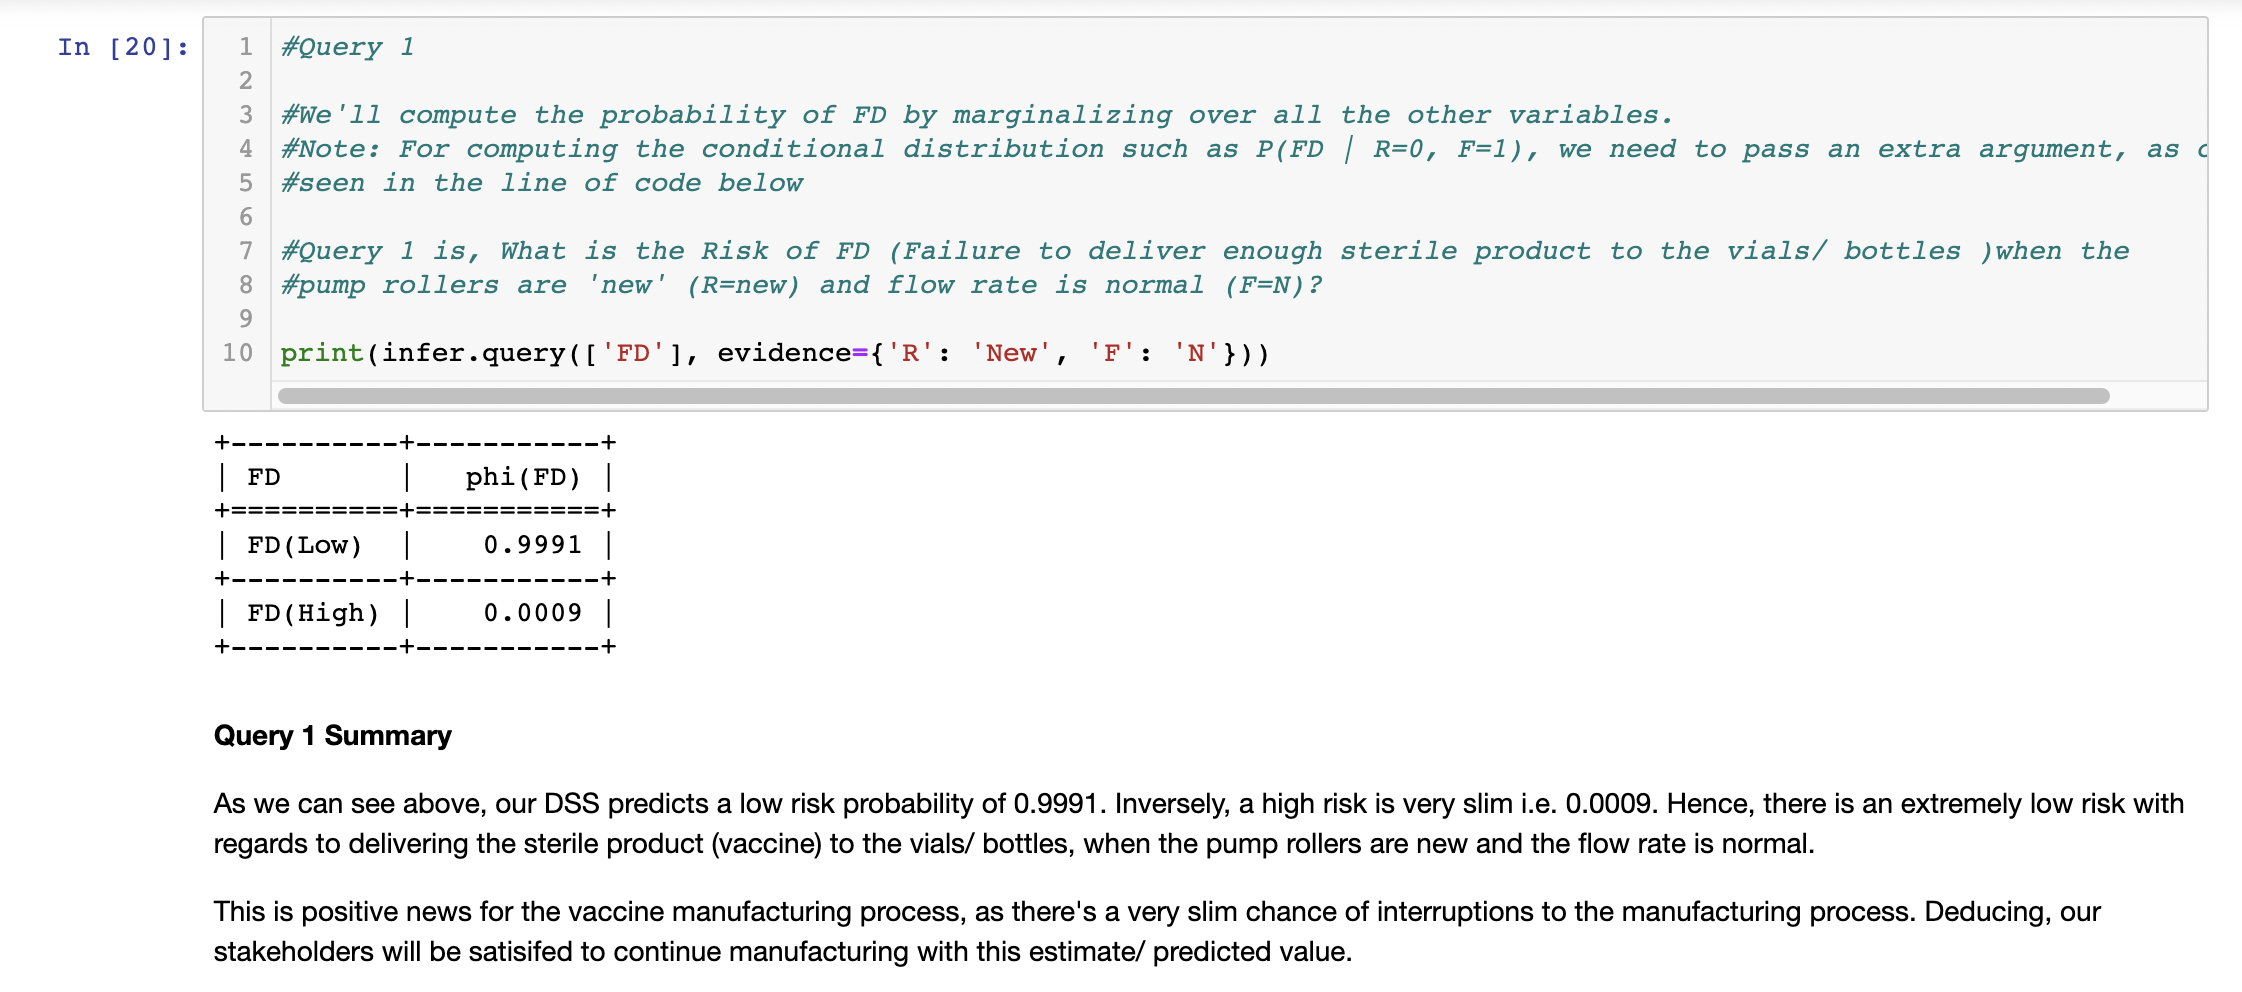
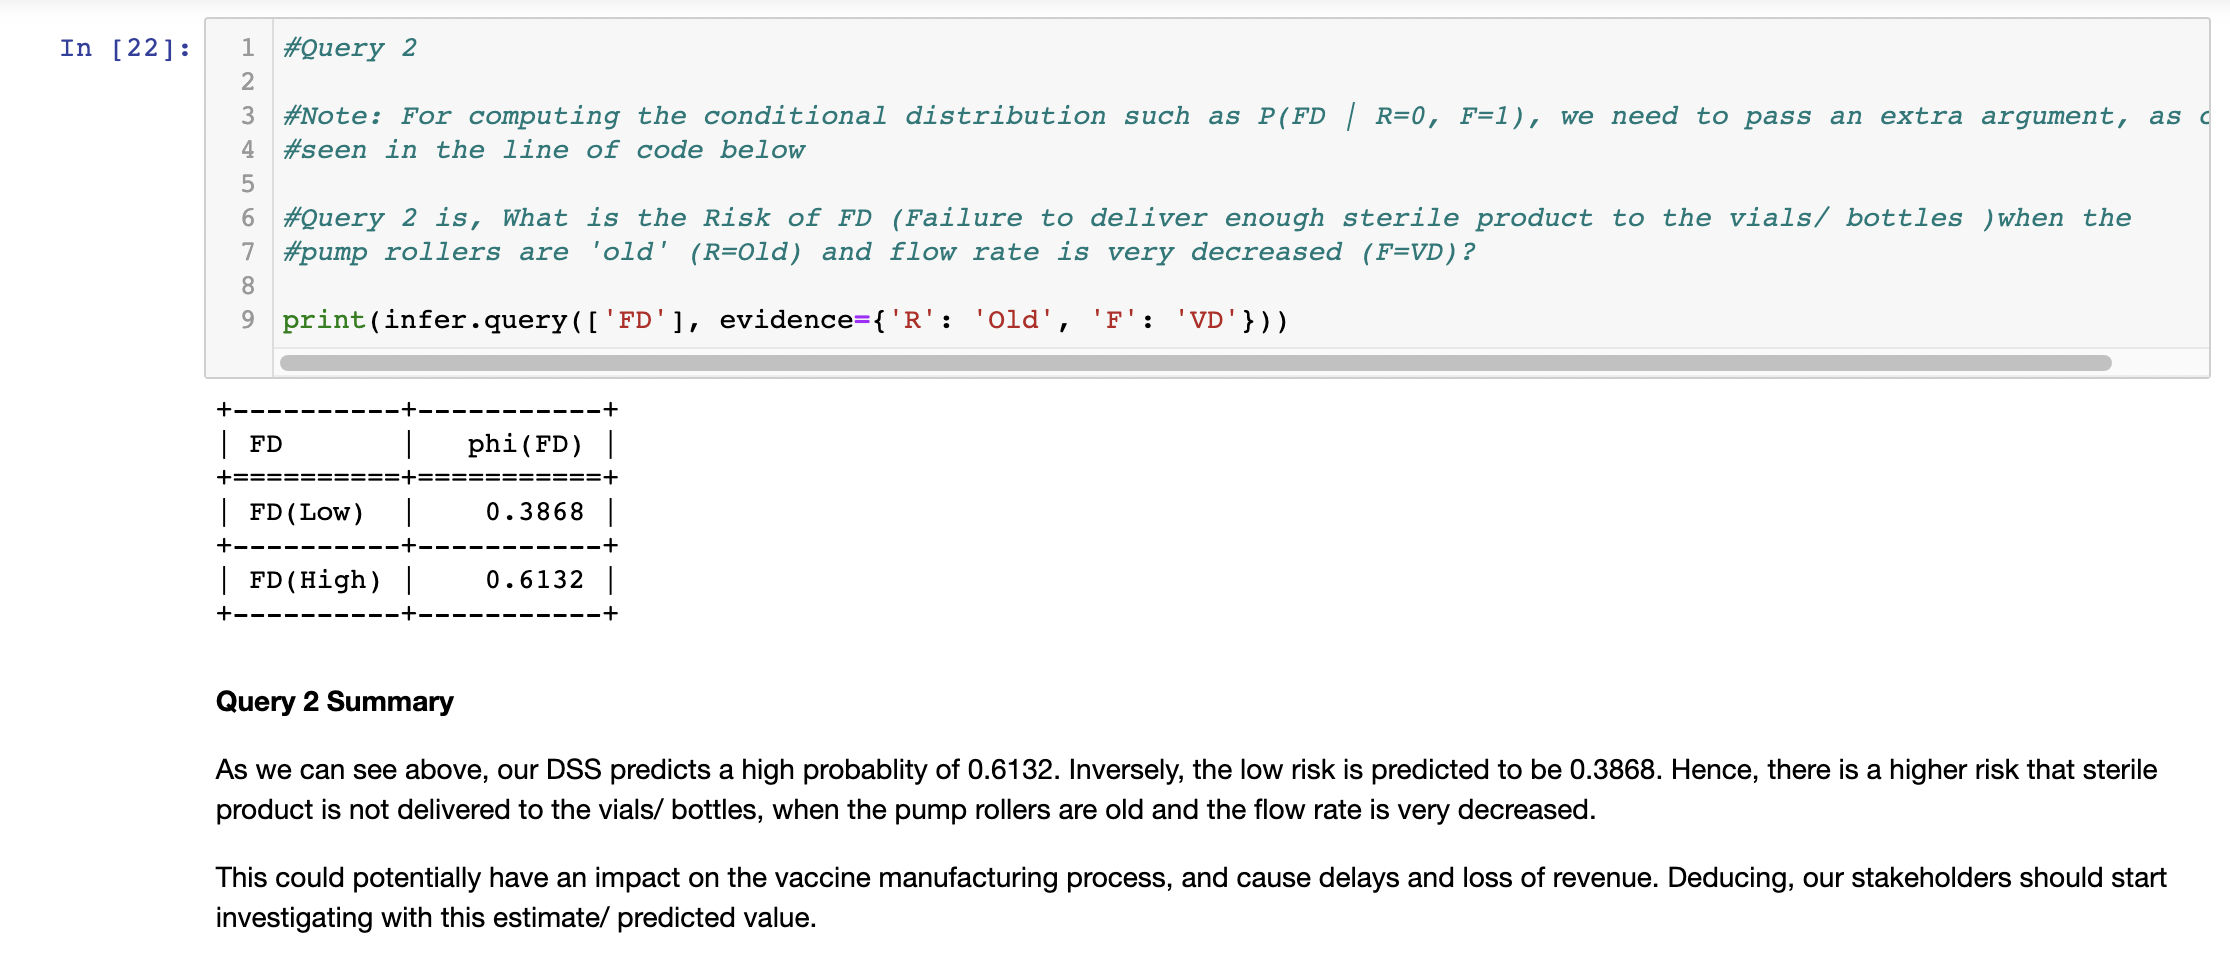
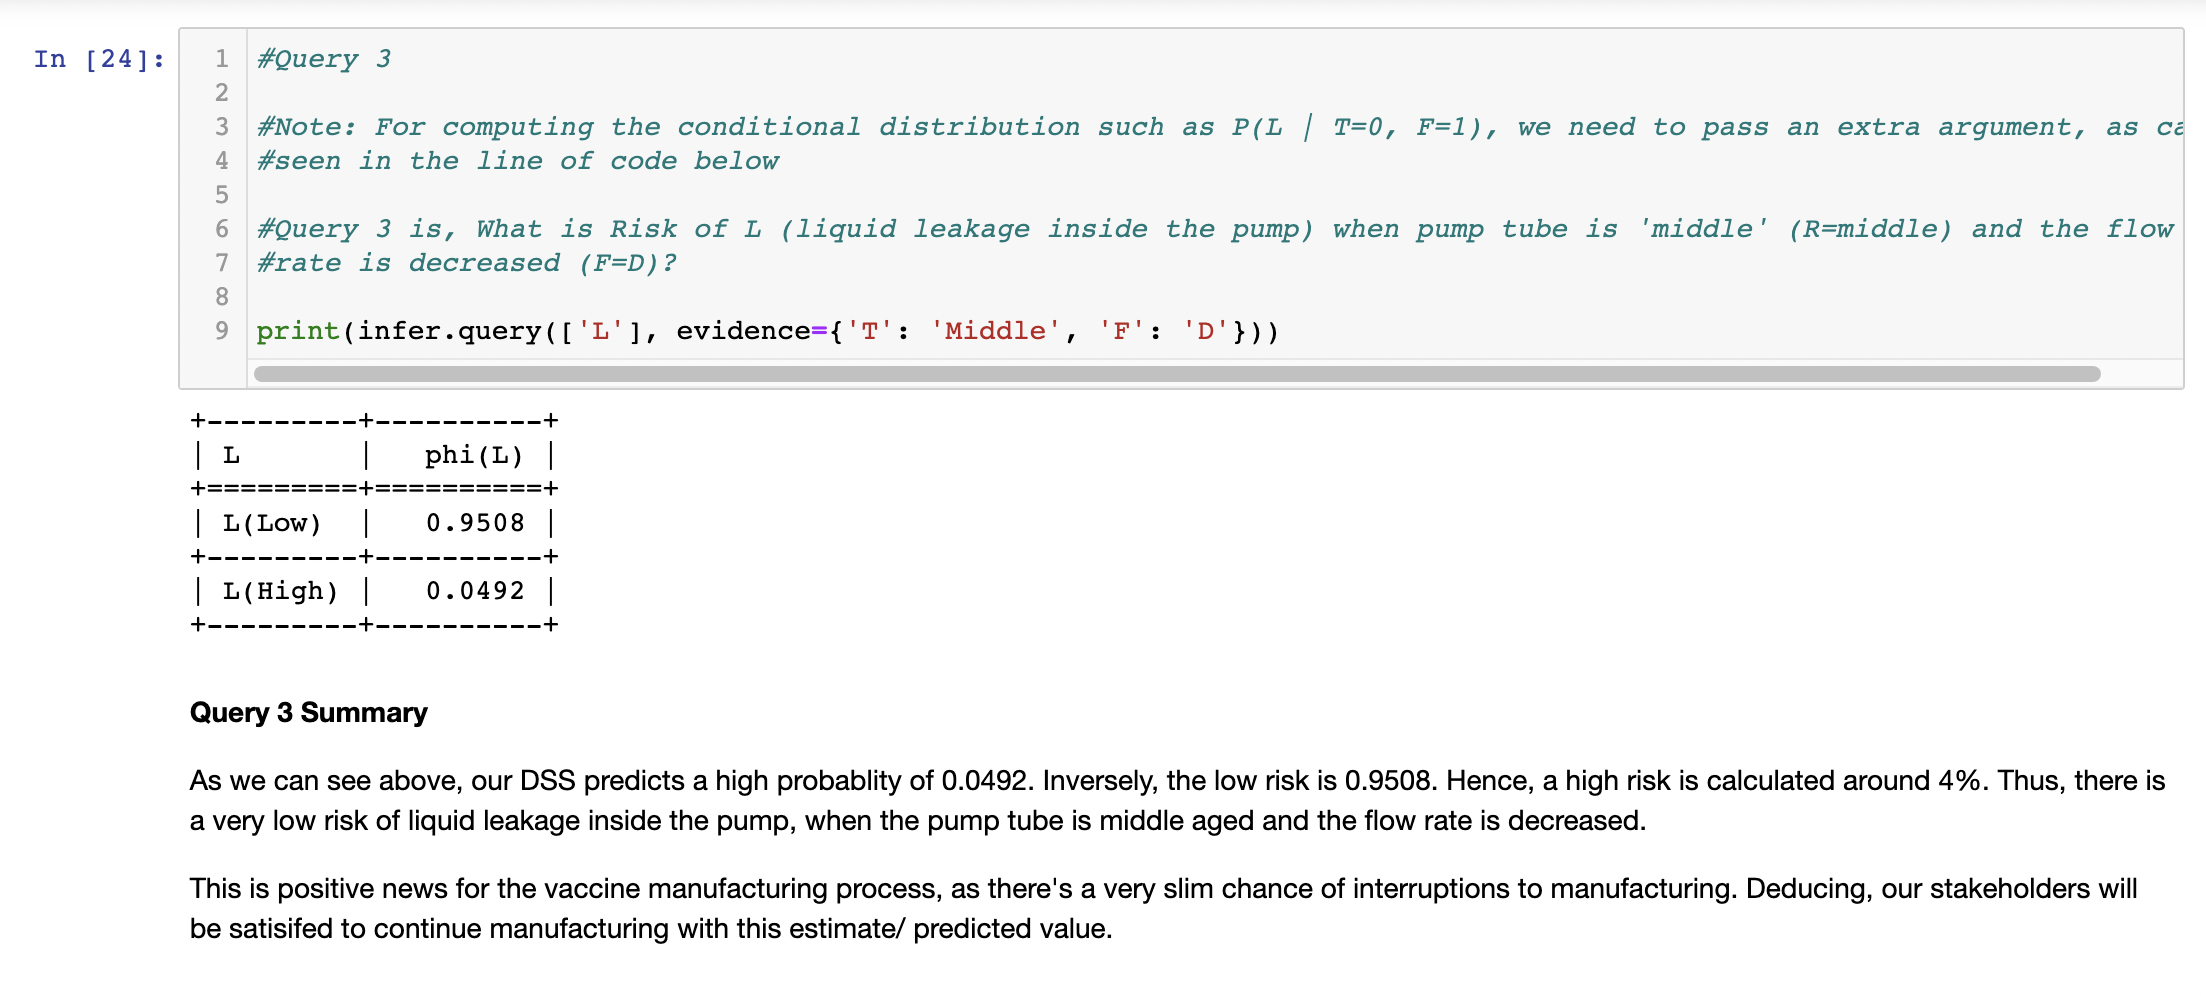
As can be derived from the code snippets below, the Decision Support System provides satisfactory results to our 3 queries.
Hence, this could be deployed as a decision-making tool, to aid in minimizing downtime in production with its real time fault detection via the digital twin. Thus, saving costs over the long term via less inspections and a reduction in spoiled manufacturing batches.
Potentially, we could further reduce manpower (and employ elsewhere on site) and costs by using green, amber and red condition states, based on the estimated risk/ predicted values from the Decision Support System. Thus, this Decision Support System provides good preliminary results for our stakeholders.

Author: Stephen
Founder of HealthyData.Science · 20+ years in life sciences compliance & software validation · MSc in Data Science & Artificial Intelligence.